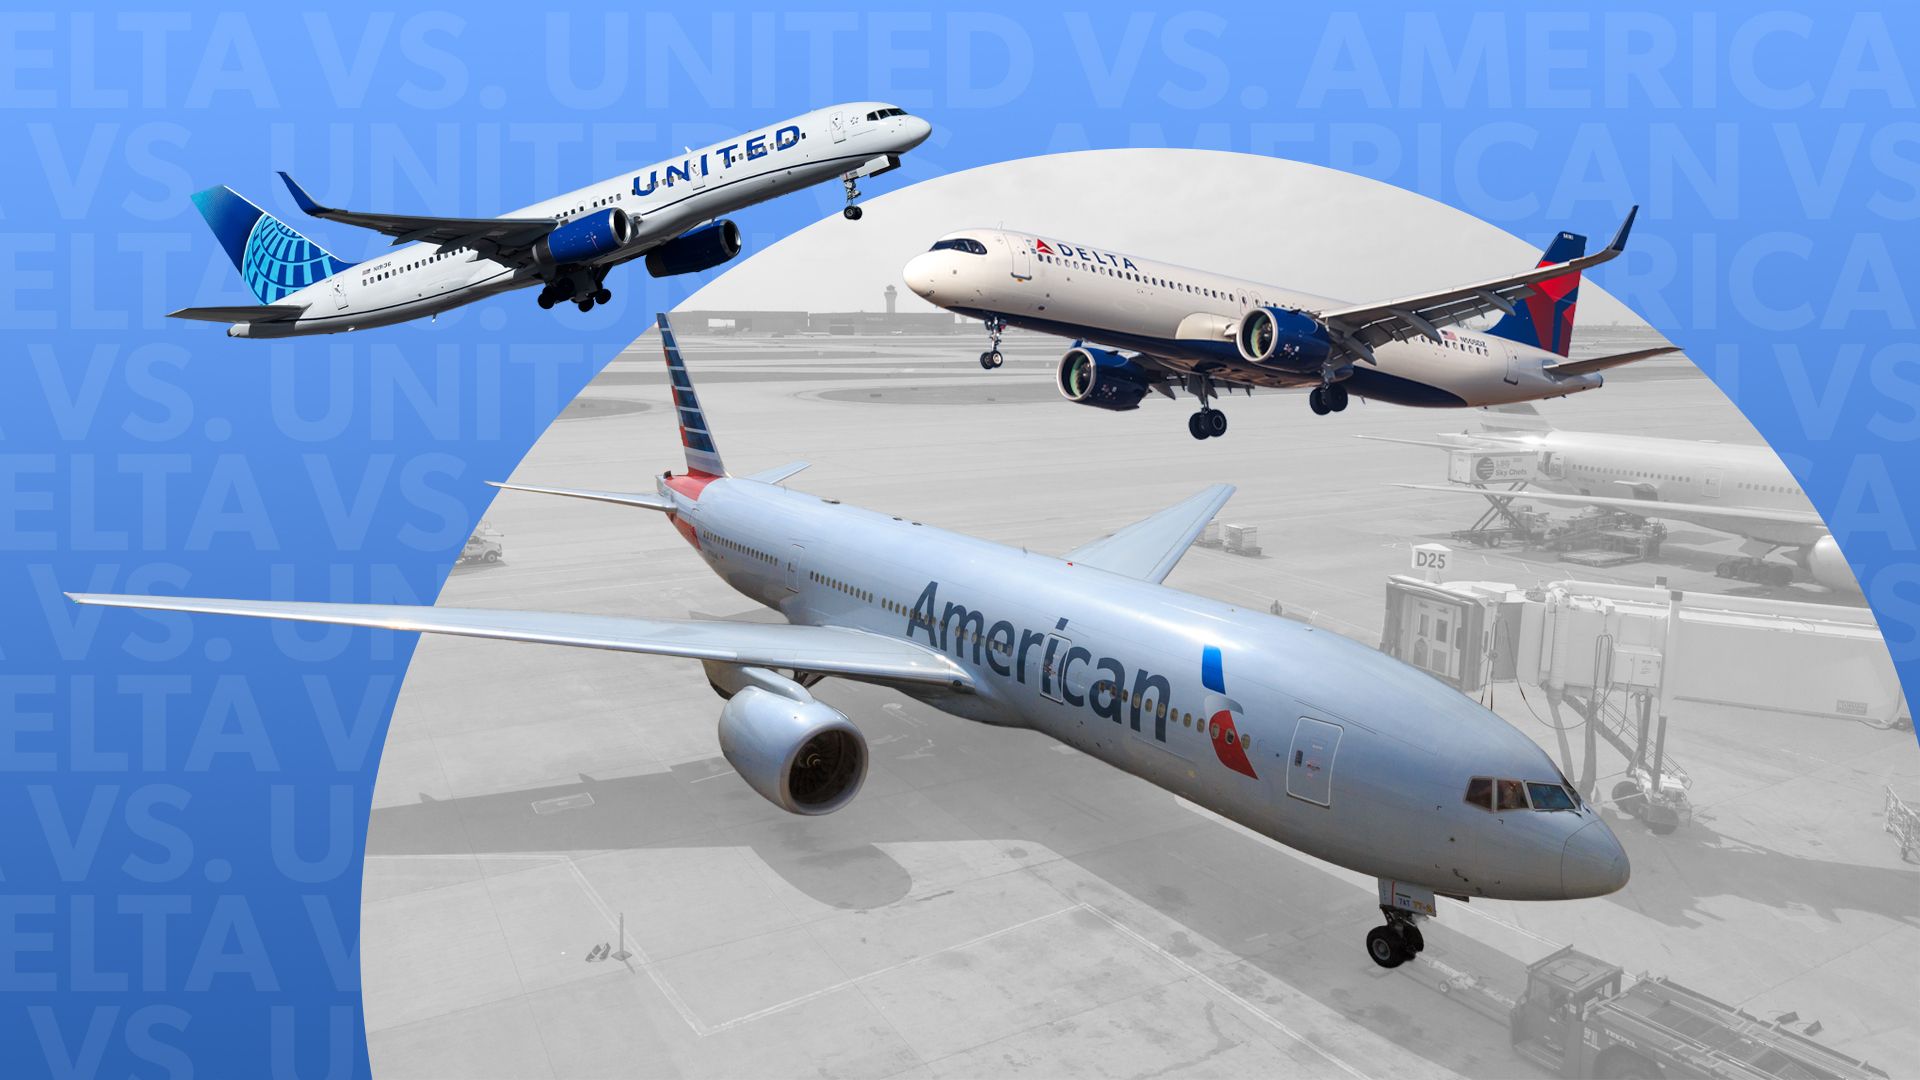
American vs. Delta vs. United: Which Airlines Suffer the Most Delays?

Understanding Flight Delays and the Performance of Major U.S. Airlines
While many travelers might be frustrated by flight delays, it’s important to recognize the complex systems that keep air travel running as smoothly as possible. The three largest airlines in the United States—United Airlines, Delta Air Lines, and American Airlines—are the result of significant mergers over the years. These companies have grown into major players in the aviation industry, with fleets consisting of hundreds of aircraft. Each of these carriers plays a critical role in connecting passengers across the country and internationally.
Causes of Flight Delays
The U.S. Department of Transportation’s Bureau of Transportation Statistics (BTS) tracks flight performance and defines a delay as an arrival 15 minutes or more behind schedule. This means the focus is on the arrival time rather than the departure. According to BTS data from January to April 2025, 78.8% of flights arrived on time, while 20.4% were delayed, 1.6% were canceled, and 0.2% were diverted.
Weather is a major contributor to delays, often acting as a catalyst for broader system-wide issues. The primary causes of late-arriving flights include:
Aircraft arriving late (6.7%)
Air carrier delays (6.0%)
National aviation system delays (5.8%)
Weather delays (0.8%)
* Security delays (0.04%)
Delays can create a ripple effect. For example, if a flight is delayed due to weather at one airport, it may cause subsequent flights to be late, leading to additional delays categorized under "aircraft arriving late."
American Airlines’ Performance in 2025
According to BTS data, American Airlines had an on-time arrival rate of 76.3% between January and April 2025, with 21.4% of flights delayed, 2.0% canceled, and 0.3% diverted. The main causes of delays included aircraft arriving late (8%), air carrier delays (6.4%), and national aviation system delays (6.3%).
American Airlines also faced challenges with customer service, ranking as the worst airline for mishandled bags (0.79%) and second-worst for involuntary bumping (0.67 per 10,000 passengers). Its mainline fleet includes 992 aircraft, composed of narrowbody models like the Airbus A320 and Boeing 737, as well as widebody jets such as the Boeing 777 and 787 Dreamliner.
Delta Air Lines’ On-Time Performance
Delta Air Lines has consistently been one of the most reliable carriers in the U.S. Between January and April 2025, 80.2% of its flights arrived on time, with only 18.5% delayed, 1.0% canceled, and 0.2% diverted. The breakdown of delays included air carrier delays (6.8%), national aviation system delays (5.7%), and aircraft arriving late (5.6%).
In terms of customer service, Delta ranked third for the fewest cancellations and second for delays. It also topped the list for involuntary bumping, with zero incidents per 100,000 passengers. Additionally, Delta was the best airline for mishandled wheelchairs.
United Airlines’ Performance in 2025
United Airlines had the highest on-time rate among the big three, with 81.2% of flights arriving on time between January and April 2025. However, it still experienced delays, with 17.8% of flights delayed, 0.7% canceled, and 0.2% diverted. The primary causes of delays included air carrier delays (6.8%), national aviation system delays (5.7%), and aircraft arriving late (5.6%).
Despite its strong on-time performance, CBS News ranked United as the third-worst airline for cancellations and third-best for delays. It also ranked third for involuntary bumping, with a rate of 0.3 per 100,000 passengers.
Global Rankings and Market Position
When it comes to global rankings, U.S. carriers rarely make the top spots. According to Skytrax's 2025 listing, Qatar Airways, Singapore Airlines, Cathay Pacific, Emirates, and ANA were ranked as the world's best airlines. Delta Air Lines was the highest-ranked U.S. carrier at 22nd place, while United fell to 51st, and American was at 83rd.
In terms of market value, Delta leads the pack with a $37.9 billion valuation, followed by United at $29 billion. American, however, ranks much lower at 19th with a value of $8.2 billion, below Alaska Airlines.
Comparing the Big Three
Hawaiian Airlines holds the title of the most on-time U.S. carrier, but it has a smaller market share compared to the big three. Delta has the largest domestic market share at 17.9%, followed by American at 17.3%, United at 16.1%, and Southwest at 16.9%.
In terms of daily flights, the American Airlines group averaged 5,625 round-trip flights per day in February 2025, more than any other carrier. Delta followed with 4,266, then United with 4,066, and Southwest with 3,715.
Post a Comment for "American vs. Delta vs. United: Which Airlines Suffer the Most Delays?"
Post a Comment